Module 1: The Process Controller
<Process Controller Tasks>
The Blue Prism Process Controller supports and administers the day to day running of the Blue Prism processes in the live environment - in effect, acting as the team leader of the Digital Workers and playing a crucial role in ensuring the smooth execution of work in the Blue Prism environment by Digital Workers.
<Magnage the Procsss Handover>
The handover process from the developer to the operations team is a critical step in the successful deployment and maintenance of Blue Prism automated processes.
The handover process from the developer to operations is a collaborative effort that requires effective communication, documentation, testing, and training. A successful handover process ensures that the automated solution is deployed and maintained effectively, and that it continues to provide value to the organization.
<Operational Handbook>
What is an Operational Handbook?
An Operational Handbook is a document which is populated by the Automation team ahead of a process automation moving into production. It normally forms part of the release sign-off and handover into support.
Format
The Operational Handbook can be maintained in a number of formats such as Word and Excel. However, a more effective approach is the use of a wiki which is easier to maintain and to navigate, although there may, of course, be additional costs involved.
Whichever format is selected, we recommend that a standardised approach is taken to completing the handbook so that it can be easily read by the relevant stakeholders and all required information is captured effectively.
Module 2: The Control Room
The Blue Prism Control Room is a critical component of the Blue Prism platform. It provides the interface to manage and monitor their digital workforce effectively. Its main purpose is to:
- Provide a secure and centralized environment for automating business processes
- Provide an interface to schedule robotic tasks, manage users and roles, and monitor the uptime and performance of the Digital Workers

[!] It is important to note that depending on your deployment of Blue Prism you may be using a browser-based control room. Although there are some differences between the two, for the purposes of the Process Controller role, all tasks mentioned in this section can also be completed in the browser-based option. Please refer to the “How To” Videos included in this module to view the mentioned tasks within a browser environment.
Module 3: Work Queues
Work queues are used to store and manage work items that are waiting to be processed. Each work item typically represents a single task or transaction that needs to be completed, such as processing an invoice or handling a customer support request.
- Manage the distribution of work items across multiple resources, such as different digital or human workers
- Track the progress of each item through the process
Reference: Queue management (blueprism.com)
Queue management
Queue management Work queues provide a mechanism for modelling the queueing, locking and reporting of work items within a Blue Prism environment. A queue contains a number of work items, which a session can lock and work within a process or business object
bpdocs.blueprism.com
Module 4: Schedules
Rather than running each process manually, the Process Controller will be required to create and configure a schedule for Blue Prism to execute processes at specified times and repeat their execution at various intervals.
This document is a guide to using the scheduling feature of Blue Prism, including timetables and scheduler reports.
Modules 5: Logging
Logging is an essential part of the Blue Prism platform. It provides the information needed to ensure processes are running smoothly and in compliance with industry standards and regulations.
<View and Analyze Logs>
Debugging and Troubleshooting
Logs allow developers to debug/troubleshoot their code by providing them with a record of what happened during the execution of a process. If something goes wrong, the developer can review the logs and identify and resolve the issue.
Auditing
Performance Monitoring
<How to set logging options on a Runtime Resource/Digital Worker?>
It is possible to override the stage logging option which has been assigned in a Process or Business Object and set the option at the Runtime Resource / Digital Worker level during runtime. This means that each Resource can have its own logging option defined. By setting a resource to have it's own logging option, users (developers/operations/QA/testing) can debug and troubleshoot issues faster, making it easier to identify unhappy paths, patterns of discontinuity and so on.
To set the logging option for a Runtime Resource/Digital Worker:
- Navigate to the Resources > Management area of System, where a context menu option is provided to set the Logging Level options.
- Right mouse-click on the relevant Runtime Resource and then select Logging Level.
- Select one of the following options as required.
Default
Logs any stages which have Stage Logging set to 'Enabled' in the Process or Business Object which the Runtime Resource is running.
All Stages
Logs all stages regardless of which stages specifically have Stage Logging set to 'Enabled'. Note this may slow down operation of any Processes run by the Runtime Resource and will result in fuller logs. However, this may be useful in diagnosing problems.
Key Stage
Overrides only the following stages regardless of which stages specifically have Stage Logging set to 'Enabled'.
Action, Code, Navigate, Process, Read, Write, WaitStart
Errors Only
Selecting this option will display session logs only when an error is encountered, which means the log session viewer will not display logs of every stage unless there is an error.
Log Memory Usage
Records the memory levels of a machine in the session logs. If enabled, all process log entries are accompanied by a record of how much memory (Working Set) was in use by the main Blue Prism executable at the time. Additionally, if the logged action refers to a target application, the identity and memory usage of that target application is also recorded.
Include Memory Cleanup
Produces more useful figures when diagnosing suspected memory leak issues.
As a good practice, process flow must be checked that a data held by digital worker must be released/closed after processing the data; else, it will prevent the digital worker from performing other tasks and slows down the business process.
This option is available once the Log Memory Usage setting is enabled.
Log Web Service Communication
Causes low-level web service communication to be logged - specifically, SOAP messages are logged in full detail. For consumed web services, the information is logged as part of the corresponding session log. For exposed web services, it is logged in the event log for the relevant Runtime Resource.
[!] If a Runtime Resource is online when its logging options/settings are changed, it does not need to be restarted for the new settings to take effect. It will pick up and begin using the modified settings within two minutes at the most.
How to enable Unicode logging?
In Blue Prism, errors are logged in Non-Unicode format by default. Although it is generally not recommended to use Unicode, it is useful in instances where logging text containing non-standard characters like logographic or symbols is required.
Unicode support is enabled automatically throughout the product except for Session Logging (in other words, the logging which takes place as processes execute). If Unicode support is required for Session Logging this can be enabled manually within System settings:
Navigate to System -> Settings -> Database and then select the Enable Unicode support for session logs check box.
Unicode support for session logging
Unicode support for session logging is disabled by default since it requires increased SQL disk space. Because Unicode characters require increased amounts of disk storage in comparison to ASCII. Prior to enabling Unicode support for the Session Logs, the amount of available disk space should be considered in line with the current log retention and archiving strategy.
[!] Note: It is generally not recommended to use Unicode. Several factors determine the likely volumes of data which logging will produce and therefore it’s difficult to predict the amount of disk space required to store this data. In general, a high logging level contributes to a higher amount of data per single Runtime Process execution, but this is acceptable on a development environment where the number of process executions are limited. A low logging level contributes to a lower amount of data per single Runtime Process execution, but processes run continuously on a production environment generating a high number of smaller logs.
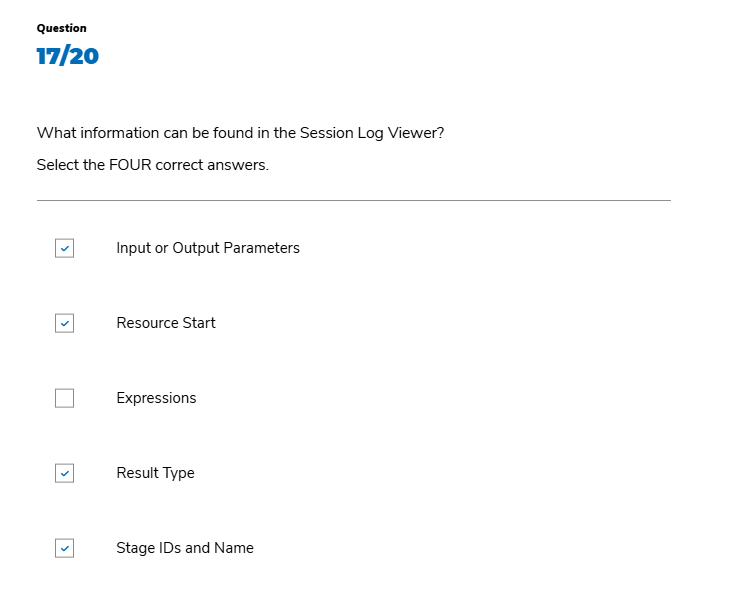
<How is the Log Viewer Used>
Whenever a Process runs, it makes a record of each step it takes to create a Session Log.
The Log Viewer is used to inspect the log of a session, either as it is running or after it has finished. This is especially handy for reviewing the workings of a Process and tracking down problems. The Log Viewer has a search function, that enables you to look through the (often numerous) rows of a log and the visibility of columns can be configured to suit.
You can access Session Log in Log Viewer from Control Room.
To access the Log Viewer
- In the Environment area of Control Room, select one of the Session rows.
- Right mouse-click to open the context menu and then select View Log.
Logs can be displayed in Grid or List view type. The Search function helps to find and highlight keywords and text analyzing all or only specific columns.
How are logs viewed in Process and Object Studio?
During development and test activity, you can view the Session Log being created for your debug or test activity from within Process and Object Studios. This will raise awareness of the logs being created at an early stage and help you make the appropriate decisions and adjustments to the logging settings of each of the stages.
Session Logs accessed from within Process or Object Studio are displayed in the usual Log Viewer window.
To view session logs in the Process or Object Studio:
Select the Show log viewer icon available in the Status bar area of Process or Object Studio.
<What issues might arise with logging? >
When Blue Prism Processes are run by Runtime Resources, log information is written to the Blue Prism database. Over time, and if not regularly monitored and maintained, the amount of data can get prohibitively large, potentially affecting the performance of the product and leading to an inability to establish a reliable automatic archiving function within the Blue Prism product.
<What best practices can be follwed with logging?>
Avoid logging on production systems
Logging for stages within an Object should only be enabled during the development phases of a Blue Prism implementation. Logging Objects is not recommended for Production systems.
Enable the level based on the purpose
Logging for stages within a Process can be enabled to whatever level is required, based on the purpose - to support debugging and tracing during Development phases, or for auditing and reporting purposes when the Processes are deployed in a Production environment. The level required will be determined by Blue Prism developers in Development and Testing phases, and by the business requirements in Production.
Several factors determine the likely volumes of data which logging will produce and therefore it’s difficult to predict the amount of disk space required to store this data. In general:
- A high logging level contributes to a higher amount of data per single Runtime Process execution, but this is acceptable on a development environment where the number of process executions are limited.
- A low logging level contributes to a lower amount of data per single Runtime Process execution, but processes run continuously on a production environment generating a high number of smaller logs.
Therefore, for production environment, it is not recommended to use logging, but if the customer's RPA team shows interest in debugging and further development, then it can used after due consideration and assuring sufficient disk space.
Turn on logging as required to create a usable audit trail
Often a usable audit trail can be created by turning on logging only for the following stages within a Process:
- All Decision stages
- All Choice stages
- All Errors
- All Work Queue – Get Next Item
Turn off logging anywhere that might generate a large amount of data
Look for:
- Loops which use large data sets
- Stages with lots of Input and Output Parameters
Identify Data Item data types that will consume larger amounts of disk space
Some Data Item data types logged with parameter logging will consume larger amounts of disk space:
- Collections – especially nested Collections
- Markup for formatted text - for example, JSON data, decoded HTML web pages, or large XML strings
- Text – large strings of more than 4000 characters in one Data Item
- Images - pictures uploaded into Data Items. Lossless image formats will store more data
- Binary - strings of Binary data
After identifying the data item data type, you can choose to disable/uncheck parameter logging.
Avoid running processes 24 * 7
<Security considerations with logging>
Care should be taken during design and development to ensure that data protection policies (that is, PCI compliance) are kept to by the Blue Prism solution. Logging should only be turned on to the minimum levels required to support the process and trace case routes and outcomes. For example, case IDs or customer IDs may be logged, but personal client information should never be logged.
Blue Prism recommends reducing the logged stages to a minimum level and to ensure that no client data is logged as part of that.
One method of ensuring data security is to check that the option Don't log parameters on this stage is checked for all stages which may contain sensitive data.
<Database monitoring consideratinos with logging>
Blue Prism stores log details on the database in the [BPASessionLog_NonUnicode] or [BPASessionLog_Unicode] tables. Monitoring and auditing of these tables through third-party tools is allowed (verify you have the correct permissions to access the required table); however, please note, database speed and other aspects such as the following could be impacted by database monitoring:
- Health of allocated hardware (e.g. disk space, CPU utilisation, network connectivity)
- Availability of specific windows services (e.g. service started, responding on the appropriate port)
- Windows Event Viewer entries
Database Administrators can assist with the upfront and on-going assessment of the amount of disk space which the Blue Prism database may require. Monitoring the size of how much data is created for each Process in terms of the number of rows and space used by that data will help decide some aspects of database set up.
<Archiving and Backup considerations>
A sensible archive strategy will allow the production database size to be kept to a minimum whilst still allowing retrieval of log files, should business units require them.
Backing up production Process and Business Objects will provide some resilience to database failure for business-critical processes.
Module 6: Monitoring
<Reporting Best Practice>
As a Process Controller, effective reporting is an integral aspect of communicating the success and value of your intelligent automation initiatives to the organization. Understanding what to measure and report on is crucial for showcasing the impact of your digital workforce. Here are key considerations for a Process Controller to customize reporting to the intended audience:
Internal COE
Provide an overview of the day-to-day running of your workforce is essential Highlight issues and areas where improvement is needed, as well as showcasing successful implementations.
Project Sponsor & Head of Automation
Demonstrate Return on Investment (ROI) to convey the tangible benefits of intelligent automation to the entire organization. Report on costs associated with running your capability and any continuous improvement initiatives.
Whole Organization
Treat automation as a service to the business, emphasizing its role in enhancing operational efficiency and supporting business objectives. Clearly communicate the continued value realization of all automation initiatives to date.
IT
Report on the service to the organization from the IT perspective, including metrics such as availability, infrastructure health, and network quality. This ensures a holistic view of the automation's impact on the IT environment.
Operational Business Area Leads
Report on day-to-day operations utilising the digital workforce, providing a comprehensive overview of the workforce performance and how automation contributes to routine business functions.
Operational Business Area Teams
Focus on exceptions and cases that are required to be worked by the human workforce. Remember to provide insights and success stories into how the digital workforce is successfully helping with the workload and goals of the team.
<Workforce Optimization>
To ensure the resilience and optimal performance of your digital workers, it is essential to consider the following factors when defining optimization methods:
-Efficiently allocate resources to balance the workload and maximize productivity.
-Determine the optimal number of digital workers required for a given task or workload.
-Anticipate and plan for seasonal variations in demand, adjusting the digital workforce accordingly.
-Prepare for sudden spikes in workload by implementing scalable solutions and ensuring the availability of additional digital workers when needed.
-Agree on task dependencies and timing during the design stage to streamline workflows and avoid bottlenecks.
-Strategically design and agree upon overnight schedules to optimize workload distribution and maintain efficiency.
-Consider the frequency of tasks and adjust the digital workforce to handle repetitive or high-frequency processes effectively.
-Manage risks to the organization by monitoring and adhering to Service Level Agreements (SLAs) and ensuring server capacity meets the demands of the workload.
-Perform trend analysis to identify repeat problems and patterns in digital workforce performance.
-Make recommendations for resolution to proactively address and prevent recurring issues.
-Suggest and drive improvements to processes in production to decrease exception rates.
-Enhance overall performance and utilization of the digital workforce through continuous process refinement.
<Monitor Performance>
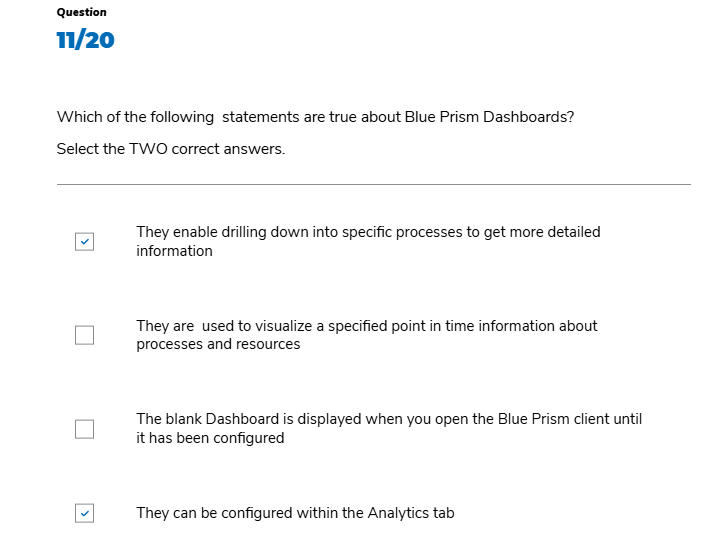
The default Dashboard is displayed when you open the Blue Prism client. Further dashboards can be configured within the Analytics tab.
From any dashboard, the process controller can drill down into specific processes to get more detailed information, such as the number of instances running, the number of exceptions, and the execution time of each instance.
In- built visualizations included in the tile library include status of the process, the number of successful and failed executions, and average execution time. Any visualization can be configured further, and more tiles can be configured for inclusion within the dashboards.
Further to the inbuilt analytics capabilities, Blue Prism supports third party analytics tools such as Splunk and PowerBI via Blue Prism’s Data Gateway functionality.
Select this link for more information on Data Gateways Settings.
Data Gateways settings
Data Gateways settings Configure the Data Gateways engine by determining what data will be processed and where relevant, the frequency at which data is sent. From the System tab, select Data Gateways > Settings. Select the required options to determine whe
bpdocs.blueprism.com
Analytics
Analytics The Analytics area allows users with the correct permissions to view and edit dashboards. Dashboards are a collection of tiles which provide a visual representation of information from various data sets. A default dashboard is automatically insta
bpdocs.blueprism.com
Dashboard tiles (blueprism.com)
Dashboard tiles
Dashboard tiles Dashboards are a collection of tiles which provide a visual representation of information from various data sets. Tiles are created and stored in the Tile Library tab and can be added to dashboards. To work with tiles users need the appropr
bpdocs.blueprism.com
Module 7 : Process Controller Role Scenarios
<Day in the life of a process controller>
The role of a Blue Prism Process Controller involves managing and monitoring the robotic process automation (RPA) solutions built using the Blue Prism platform.
Click each +/- symbols to expand/collapse the tabs and view more about what a Process Controller would do.

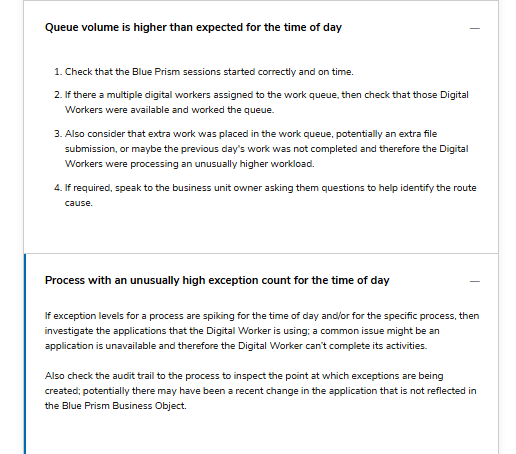
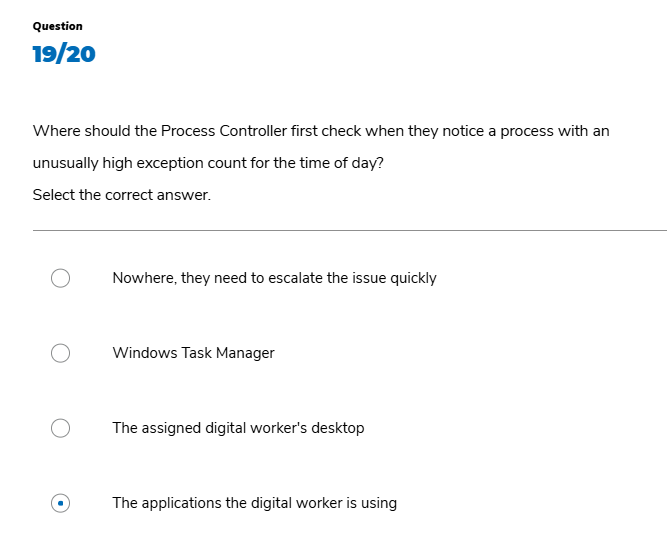
<Troubleshooting Scenario>
As a Process Controller, here are some of the scenarios you may encounter and guidance on how you can deal with them.

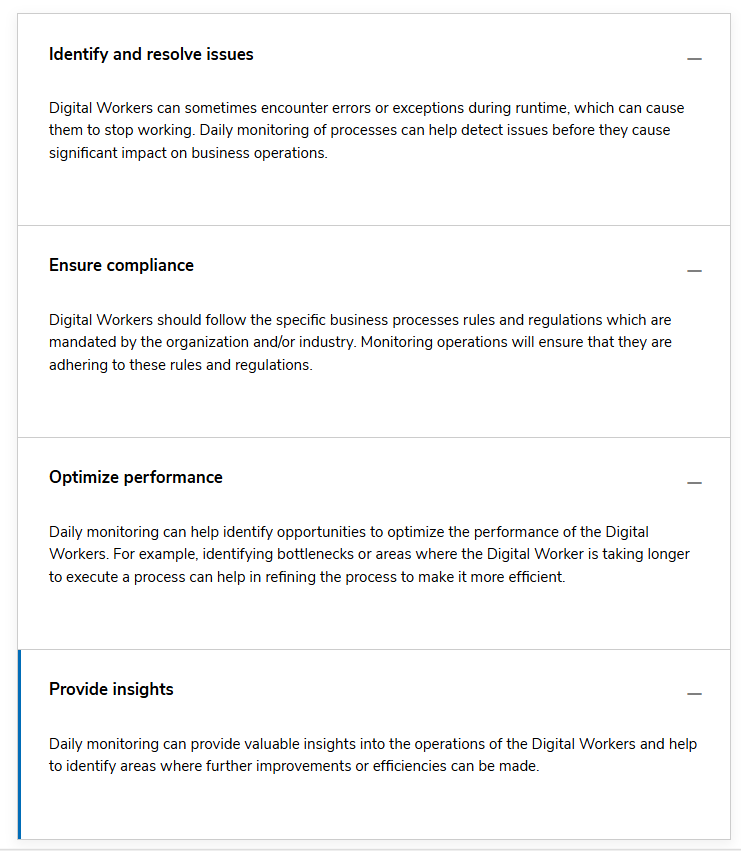
<Performing Regular Checks>
It is important to perform a daily check of Blue Prism operations to ensure that Digital Workers are running smoothly and as expected. As a Process Controller, you can perform regular checks on daily, weekly or monthly basis.
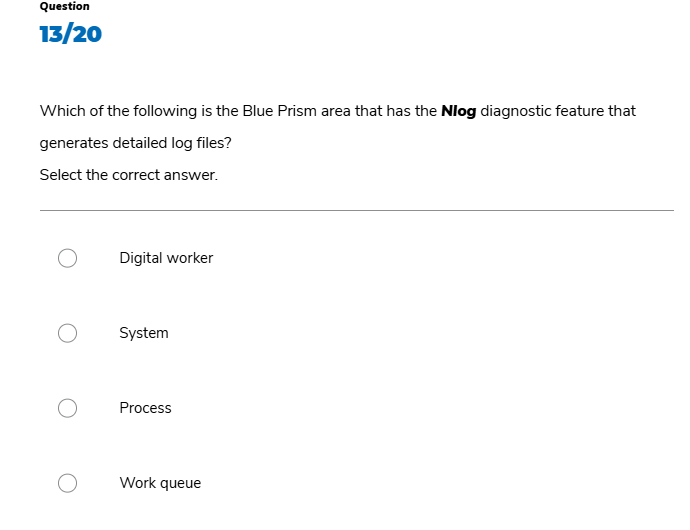
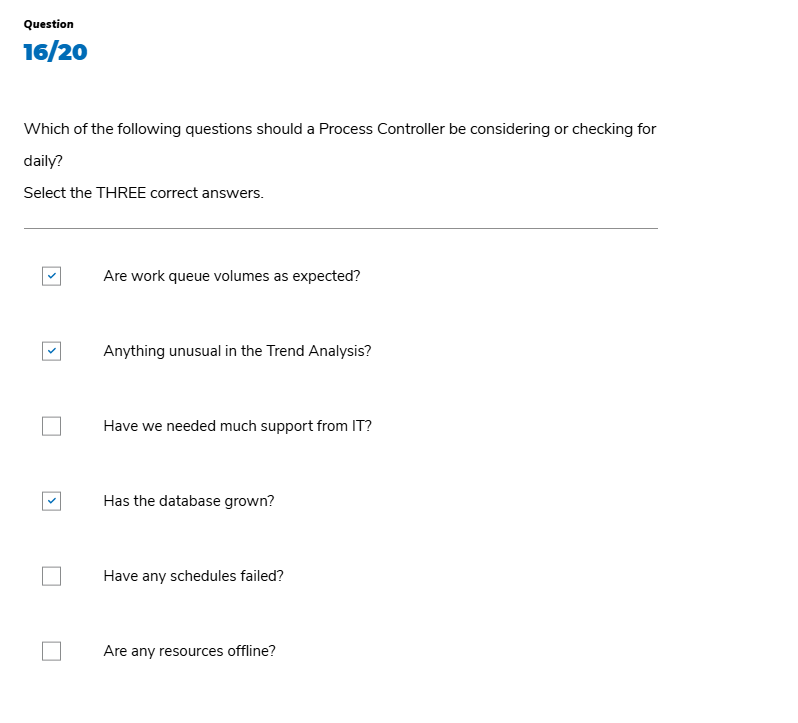
Knowledge Checks


'BluePrism' 카테고리의 다른 글
| ROM 2 Operations : Building Your Support Model (0) | 2024.06.14 |
|---|---|
| ROM2 Operations : Benefits Realization and Validation (0) | 2024.06.14 |
| ROM 2 Development : Embedding Continuous Improvement (0) | 2024.06.14 |
| ROM 2 Development : Manage Security & Access (0) | 2024.06.14 |
| ROM2 Development : Establishing Delivery Controls (0) | 2024.06.14 |